

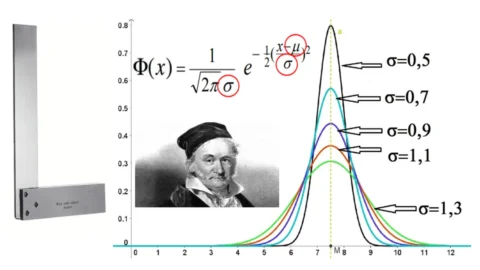
The terms “Gaussian”, “normal distribution” or “Gaussian bell” are probably known even to those who have not done mathematical or statistical studies. If they do not recall anything, not even to the reader's mind, there will almost certainly be a certain familiarity with the bell-shaped curve described in the graph that represents it. The reason is to be found in the wide spectrum of use of this tool, in various fields of human knowledge. They range from physics to demography, from estimating to logistics, from biology to economics, from medicine to astronomy, from psychology to exercise science, from finance to business management. In any case, even those who observe the bell graph for the first time quickly understand its main characteristics: there is a contrast between the center of the bell and its extremes and its shape has a perfect symmetry.
The first studies on the function that describes the trend of the probability density associated with the normal distribution were those of the French mathematician Abraham DeMoivre (1733), father of the formula that bears his name and which allows the power of a complex number to be expressed in trigonometric form. De Moivre was the first to notice that the already known binomial probability distribution, in the case of a very large sample, took on a bell shape. However, he was the German mathematician, astronomer and physicist Carl Friedrich Gauss who, in 1809, obtained the formula for this distribution as part of his studies on the error curves in the trajectories of asteroids. This discovery earned Gauss everlasting memory, so much so that - in more recent times - the Bundesbank used his portrait, the mathematical function he used and the related graph, as effigies for the 10 mark banknotes circulating in Germany until entry into force of the euro.
Neither De Moivre nor Gauss ever used the term “normal” to refer to the bell-shaped distribution that was the object of their studies. The merit of having made that trend become synonymous with "normality" and of having therefore expanded the meaning of that adjective to the concept of "custom" and "conform to the average" goes to the Belgian astronomer and statistician Adolphe Quetelet, who decided to apply the criteria with which astronomical measurements were carried out to the study of human beings and society. Until around 1850, the "standard" was nothing more than an instrument - still in existence - used in the field of measurements, which served to establish the "straightness" of an angle. Quetelet created statistics on the most disparate human characteristics and it is to him that we owe the birth of the current idea of normality relating to the individual and society.
Today, the normal distribution is the most important distribution used by anyone dealing with a large enough amount of data to classify or interpret. As already mentioned, the mean value is located exactly in the center of the distribution, as are the median and mode. Moving away from these coincident values, the curve gets closer and closer to the x-axis, but never reaches it (asymptotic trend). In its most classical generic formulation, the normal distribution actually describes a family of distributions, all with the same characteristic shape, but with bells that are more or less narrow and pointed or wider and flatter. These two factors can be varied using just two parameters: the average value µ and standard deviation σ (or standard deviation). By varying µ it is possible to move the symmetry axis of the curve horizontally, by varying σ, however the curve widens (for larger values) and flattens (for smaller values). To indicate that a variable x is distributed like a normal one, we therefore use to write X ~ N(µ,σ). For example, the values produced by a measurement process are generally normally distributed, this is because, by repeatedly measuring the same object, the instrument does not always produce the same value, but small oscillations around the average value.
When a curve describes a distribution of relative frequencies, the total area under the curve is equal to 1 (the sum of the relative frequencies). Therefore the area to the left of the mean, in a normal distribution, is equal to ½ (50% of the total), as is the area to the right of it. Therefore, almost 70% of the area lies between (x −σ) and (x +σ), as much as 95% lies between (x − 2σ) and (x + 2σ) and even 99% lies between (x − 3σ) and (x + 3σ). These σ (sigma) they are very important for the management of business processes, since they are the basis of a program quality management which was developed precisely using the Gauss bell to achieve the best possible control over the processes. First introduced by the electronics company Motorola, in the second half of the eighties, had the objective of ensuring that only 3, at most 4 parts of production out of a million were defective.
This system, renamed “Six Sigma"precisely by virtue of the ability of the extremes (x − 6σ) and (x + 6σ) to guarantee well over 99,99% of the functioning production, leaving out only 0,002% of defective production, it was so successful that it spread to other major companies, such as General Electric, Toyota, Honeywell and Microsoft. Today, the method of 6σ, in addition to being part of the study program of various university educational courses, is the basis of a certification much sought after by companies and workers.
Other examples of situations modeled by a normal distribution are, as already introduced, the random errors in measurement of a physical quantity. The error can be excessive or negative, therefore the random variable of the error in the measurement can take on – in a symmetrical way – positive or negative values. The error tends to be quite small, or rather, larger errors are less likely, so the curve decreases rapidly as one moves away from 0 (zero error), in both directions.
Those who deal with demographic sciences know perfectly well how, many quantities relating to a population homogeneous distribution of people, can be represented by a Gaussian distribution, having µ equal to the average value of the size in the population. Height, weight, body mass index, blood pressure values, blood sugar levels and many other measurable characteristics have a normal distribution with appropriate µ and σ.
In a plant mass production of spare parts, the actual size of the objects produced can, for example, oscillate around the average value µ, which represents the optimal size. The objective of those who supervise the machinery responsible for mass production could be to ensure that the standard deviation σ is as small as possible.
The Wechsler Adult Intelligence Scale (or WAIS) is the most well-known intelligence test used in adulthood and is the test based on which it was possible, for the first time, to have standardized IQ scores (IQ), having a mean equal to 100 and a standard deviation equal to 15. Once again we are faced with quantities that are distributed along a bell curve like that of Gauss, which allow us to identify a population range based on IQ. The international "Mensa" association, for example, is made up of people who have reached or exceeded 98% of the world population based on their IQ, i.e. a score greater than 130 on the Wechsler test. This means that this is only 2% of the world's population.
The further examples that can be given are truly infinite, but certainly the ones proposed are enough to let one become passionate about one scientific culture particular, the one who manages to see the beauty in mathematical models, to be captured by the charm of a curious mutual adaptation - spontaneous - between reality and mathematics, which is almost reflected in the humanistic culture of art, that ofelegance in the representation.